My Electricity Bill Jumped From $300 to $800 in One Quarter. My Homelab Did It.
Three months of homelab expansion, adding k3s, new storage, local AI, and forgetting to clean up what I was no longer using added $500 to my electricity bill. Here is how I found it and fixed it.

My last electricity bill was $800 AUD for the quarter. Before the homelab got serious it was around $300. That is a $500 jump in three months and honestly, i did not see it coming.
I knew running servers 24/7 costs something. What i did not realise was how much of that $500 was pure waste. Not useful waste. Just forgotten stuff sitting there drawing power.
What Changed in Those Three Months
Let’s be honest about what i added.
The biggest thing was the k3s cluster. I already had a GPU passthrough VM called ghostgpu running Ollama on a GTX 1660 Super for local AI. When i built out Kubernetes and started routing workloads through it, ghostgpu’s behaviour changed. Services like Immich ML for photo recognition, Paperless AI for document classification, karakeep’s AI bookmark categorisation, all of them started touching that GPU VM in ways they were not before. The GPU went from occasional inference to consistent workload. A GTX 1660 Super under load is not light on power.
On top of that i added a second 8TB drive to TrueNAS to set up a mirror. Two spinning hard drives 24/7 instead of one. Seagate Exos drives are not heavy power consumers but they are not free either, especially during scrubs.
Then there was everything i deployed on the cluster. I went a bit overboard. Sonarr, Radarr, Prowlarr, Readarr, Audiobookshelf, Kavita, the whole arr media stack. Authentik for SSO. Prometheus and Grafana for monitoring. Paperless for documents. karakeep for bookmarks. Most of it was genuinely useful at the time.
Then life got busy. Got a Netflix subscription. Amazon Prime covers the rest. I stopped using the media stack. But i never stopped running it. All those pods sitting there in memory, nodes drawing power, doing nothing for me.
That is the part that stings.
Finding the Waste: The VMs First
First place i looked was Proxmox. I wanted to see what was actually running.
Two VMs stood out immediately.
security was a VM i provisioned months ago to set up some security tools. Never got around to deploying anything. It was just on. 8 GB of RAM, CPU cores assigned, running nothing.
ghostmedia was my old media server VM from before the Kubernetes migration. I had moved everything to the cluster but never deleted this VM. Still running Docker containers, some of them duplicating what was already on the cluster. Also 8 GB of RAM.
That is 16 GB sitting on two VMs doing nothing.
Here is the thing about Proxmox memory ballooning most people miss. Ballooning lets the hypervisor reclaim RAM from a VM down to a minimum floor you set. If that floor is too high, the balloon cannot deflate. Those VMs had their minimum at 8 GB. The host could not take a single byte back.
And idle VMs are worse than you think for CPU too. A powered-on VM needs housekeeping. The hypervisor schedules it. Those cores cannot reach deep sleep states. C-states are how a Ryzen drops power at idle. The 3600X can drop significantly when cores hit C6. Block that and the CPU sits at higher wattage around the clock, permanently.
I deleted both VMs. Biggest single win.
Finding the Waste: The Kubernetes Cluster
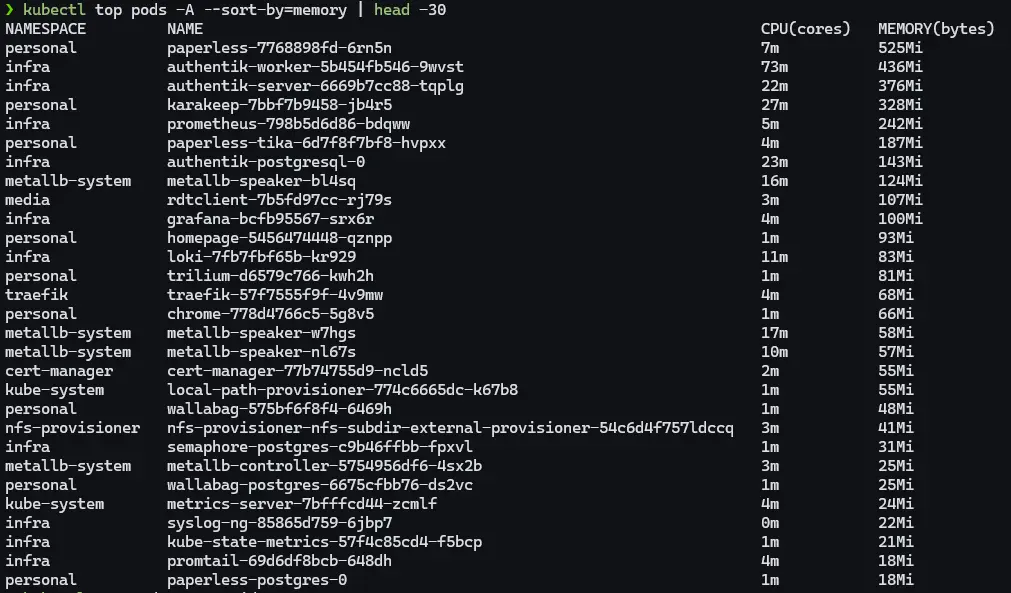
With the VMs sorted i looked at the cluster. Ran kubectl top pods -A --sort-by=memory and sorted by memory usage.
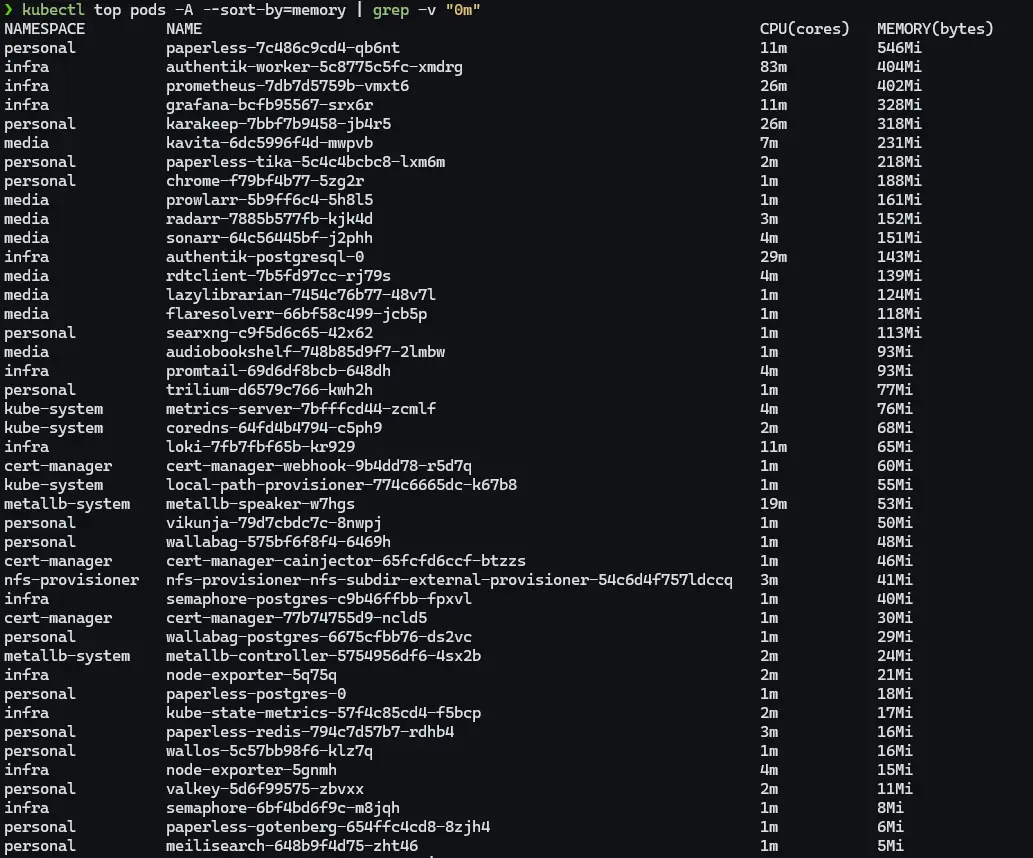
Some numbers i expected. Paperless at 587 MB, karakeep at 328 MB with its AI features, authentik nearly a gigabyte between two pods. Those made sense.
What i did not expect: Grafana at 320 MB and Prometheus at 438 MB scraping ten machines every 15 seconds. Chrome, the headless browser karakeep uses for screenshots, sitting at 188 MB with zero limits set.
And the media stack. 937 MB combined across Sonarr, Radarr, Prowlarr, Readarr, Audiobookshelf, Kavita and the rest. Full replicas. For services i had not meaningfully touched since life got busy.
Warning: RAM allocated in Kubernetes is not free. It keeps the node’s memory bus active and keeps the CPU managing page tables and caches. Not the same as an idle process doing nothing.
Fixing It
Media stack first. Scaled everything i was not using to zero:
1
kubectl scale deployment sonarr radarr prowlarr readarr audiobookshelf kavita lazylibrarian -n media --replicas=0
937 MB gone immediately. Can spin back up when i actually need them.
Prometheus. Scraping ten hosts every 15 seconds is overkill for a homelab. Changed scrape interval to 60 seconds, added a storage retention size cap. Dropped from 438 MB to 242 MB.
Chrome. No limits, no flags, just running wide open. Added flags to cap the V8 JavaScript heap and cut everything unnecessary:
1
2
3
4
5
6
args:
  - --js-flags=--max-old-space-size=128
  - --disable-extensions
  - --disable-background-networking
  - --disable-sync
  - --disable-translate
188 MB down to 66 MB.
Authentik. Default worker and thread counts designed for production. Set AUTHENTIK_WEB__WORKERS=1 and AUTHENTIK_WORKER__THREADS=1 in the Helm values file. Server came down from 515 MB to 377 MB.
Tika. Apache Tika is what Paperless uses to parse PDFs and Office files. Java application. Java will eat all the heap you give it. Added a JVM cap:
1
2
3
env:
  - name: JAVA_TOOL_OPTIONS
    value: "-Xmx128m -Xms64m"
Also found a YAML bug sitting quietly in the Paperless deployment. The replicas, selector, and template fields were under metadata instead of spec. Kubernetes was ignoring all three. Deployment was running on whatever defaults it fell back to. Hard to catch just by reading a long YAML file.
The Results
| Pod | Before | After | Saved |
|---|---|---|---|
| Grafana | 320 MB | 100 MB | 220 MB |
| Prometheus | 438 MB | 242 MB | 196 MB |
| Authentik server | 515 MB | 377 MB | 138 MB |
| Chrome | 188 MB | 66 MB | 122 MB |
| Paperless | 587 MB | 525 MB | 62 MB |
| Media stack | ~937 MB | 0 MB | 937 MB |
About 1.7 GB freed on the cluster, plus two Proxmox VMs and 16 GB of allocated RAM gone entirely.
Homeserver CPU temps dropped noticeably too. It was hitting 94 degrees Celsius during what should have been normal operation. Not dangerous for a 3600X but absolutely not idle behaviour. After the cleanup it settled back down.
Grafana made the impact very visible. This is CPU usage across all hosts over the cleanup session.
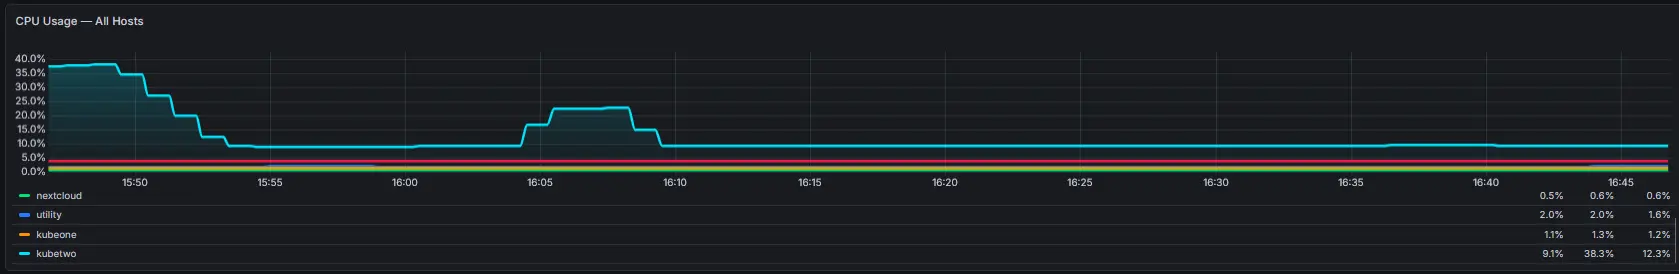
That cyan line is kubetwo. Started the session at around 35% CPU just from the bloated pods and media stack. Drops sharply after the scale-down and tuning. Spike in the middle is authentik restarting during the Helm upgrade. Then nearly nothing. The other hosts, nextcloud, utility, kubeone, flatlined the whole time. kubetwo was carrying almost all of the unnecessary load.
About the Local AI Services
I want to be honest about the AI stuff because it is a real part of the power draw and it is not going away.
I run Ollama on the GPU VM for local language models. Immich uses ML for photo face recognition and smart search. Paperless AI classifies and tags documents. karakeep uses AI for bookmarks. All on my own hardware, on purpose.
The GTX 1660 Super draws power whether it is inferring or not. When Ollama is running a model it spikes well past 100 watts. That is expected and fine.
What i did not account for was Immich. My wife and i both moved off Apple Photos and Google Photos to self-host our entire library. Combined that is around 30,000 photos going back 15 years or more. When Immich ML runs its initial scan on a library that size, face recognition, object detection, smart search indexing across every single image, it does not finish in an afternoon. It runs for days. On the CPU. Constantly. That absolutely showed up in the power draw and i did not connect it to the bill until later.
It is also not done. The library keeps growing as we migrate more. And Paperless AI has barely been touched yet. I have not even started moving documents from Nextcloud into Paperless properly. When that happens and Paperless starts processing years of old scanned documents, there will be another burst of CPU-heavy work.
So there is a baseline cost and there are spikes. The Immich scan was a spike i did not plan for. More spikes are coming. That is fine, i would rather process everything locally than hand it to Google or Apple. But knowing when those spikes are coming is the difference between a surprise bill and a planned one.
The local AI services are deliberate. The forgotten arr pods were not. That distinction matters.
This Is Not Just a Homelab Problem
This same pattern happens everywhere. VMs get provisioned for a project, nobody deletes them when it ends. Kubernetes clusters run at 15% utilisation because nobody set resource requests properly. Monitoring deployed with configs written for hundreds of machines running on eight.
Looking at actual consumption vs. what is allocated, finding what is running vs. what is actually being used, understanding which config options matter, that is real infrastructure work. The numbers are smaller here. The skill is the same.
Honestly, doing it at home on an electricity bill is better practice than doing it on a cloud bill. Every wrong call shows up in your wallet at the end of the quarter.
Tip: In Proxmox, set the balloon minimum RAM close to what the VM needs at idle, not the max you want under load. A minimum set too high means the hypervisor can never reclaim that memory.
The Short Version
- Bill went from $300 to $800 AUD in one quarter. k3s expansion, new TrueNAS drive, GPU VM workload change, and a media stack i stopped using but never scaled down all contributed.
- Idle VMs in Proxmox keep CPU cores busy enough to block deep sleep states. Higher power floor around the clock.
kubectl top pods -A --sort-by=memoryshows what is actually running. Defaults are almost never right for a homelab.- Java applications eat heap. Cap them with
-Xmxor they sit bloated forever. - Local AI on a GPU costs real power and that is fine if you are using it. Paying for that and also running forgotten pods on top is the part to fix.
The $500 is not fully reversed overnight. But i know exactly where it was coming from and how to keep it from growing back.