OPNsense Logging to Grafana via Loki: Three Gotchas That Will Catch You
Getting OPNsense firewall logs into Grafana via syslog-ng, Promtail, and Loki sounds straightforward. Three silent failure points will stop it from working and give you no error to debug.
I run this entire stack on a k3s cluster at home. syslog-ng, Promtail, Loki, and Grafana are all deployed as Kubernetes workloads in the
infranamespace. If you are running this on bare Docker or a single VM, some of the specifics will differ but the problems are the same.
So I set up the whole logging pipeline. OPNsense sending syslog to syslog-ng, syslog-ng writing to a file, Promtail tailing that file and pushing to Loki, Grafana on the other end showing everything. Ticked it off the list. Done.
Except nothing was working. Zero logs. I just never actually checked.
When I finally went to look, I found three separate problems. None of them threw an error. None of them told me anything was wrong. The pipeline just sat there silently doing nothing.
Here is what they are, so you do not have to find them yourself.
The Pipeline
Before we get into what breaks, here is what we are building:
1
2
3
4
5
6
OPNsense
  └─ UDP syslog → syslog-ng (LoadBalancer IP, port 1514)
       └─ writes to file on PVC
            └─ Promtail (tails file, parses filterlog)
                 └─ pushes to Loki
                      └─ Grafana queries Loki
syslog-ng sits in Kubernetes and receives raw syslog from OPNsense. Promtail tails the file syslog-ng writes. Loki stores it. Grafana shows it. Simple enough. Let’s see how it breaks.
Gotcha 1: syslog-ng Needs a LoadBalancer, Not ClusterIP
OPNsense lives on your LAN. It is not inside Kubernetes. When it sends a UDP syslog packet somewhere, that IP needs to be actually reachable from your network.
ClusterIP is only reachable from inside the cluster. So if your syslog-ng Service is ClusterIP, every single packet OPNsense sends just disappears. No error on the OPNsense side. No dropped message anywhere. It looks like everything is configured correctly and nothing arrives.
1
2
3
4
5
6
7
8
9
10
11
12
13
apiVersion: v1
kind: Service
metadata:
  name: syslog-ng
  namespace: infra
spec:
  type: LoadBalancer   # not ClusterIP
  ports:
    - port: 1514
      targetPort: 1514
      protocol: UDP
  selector:
    app: syslog-ng
If you have MetalLB running, changing to LoadBalancer gives you a real IP on your LAN. That is the IP you put into OPNsense.
1
2
kubectl get svc syslog-ng -n infra
# look at the EXTERNAL-IP column
Then in OPNsense go to System, Settings, Logging / Targets. Transport UDP, host set to that external IP, port 1514.
Tip: If EXTERNAL-IP stays as
<pending>forever, MetalLB either is not running or has no IP pool configured for that range.
Gotcha 2: Promtail Does Not Listen for Syslog
This one surprised me because it seems like it should work.
I had syslog-ng configured to forward logs to Promtail over UDP. Seemed reasonable. syslog-ng forwards, Promtail receives. Nope.
Promtail does not receive syslog. That is not what it does. Promtail tails files, reads new lines, pushes to Loki. It has no UDP listener, no syslog receiver. So this destination in syslog-ng was sending packets into nothing:
1
2
3
4
5
6
7
8
destination d_promtail {
  syslog(
    "promtail.infra.svc.cluster.local"
    transport("udp")
    port(1514)
    flags(syslog-protocol)
  );
};
How it actually works is simpler. syslog-ng writes to a file on a PVC. Promtail mounts that same PVC and tails the file. That is the whole relationship.
1
2
3
4
log {
  source(s_opnsense);
  destination(d_local);   # writes to /var/log/opnsense/opnsense.log
};
1
2
3
4
5
6
7
scrape_configs:
  - job_name: opnsense
    static_configs:
      - targets: [localhost]
        labels:
          job: opnsense
          __path__: /var/log/opnsense/*.log
syslog-ng writes, Promtail reads. If you also had a Traefik IngressRouteUDP pointing at Promtail port 514, remove that too. Same problem.
Gotcha 3: OPNsense Logs Are CSV and Grafana Cannot Read Them Without Help
After fixing the first two, logs started arriving in Loki. Progress. But when I tried to build a dashboard, I hit a wall.
Every OPNsense firewall log line uses a format called filterlog. Each connection gets logged as a CSV string:
1
5,,,1000000103,em0.10,match,block,in,4,0x0,,64,0,0,none,6,tcp,...
Those fields contain everything you care about: which interface, whether the connection was blocked or passed, direction, protocol. But if you do not tell Promtail to parse them, Loki stores the whole thing as a blob of text. You cannot filter by protocol. You cannot ask for blocked inbound traffic only. You just get walls of unreadable CSV in your log panels.
Field positions (0-indexed): 4 = interface, 6 = action, 7 = direction, 8 = IP version, 16 = protocol.
Add a pipeline_stages block to your Promtail config to pull the useful bits out:
1
2
3
4
5
6
7
8
pipeline_stages:
  - regex:
      expression: 'filterlog\[\d+\]: (?:[^,]*,){4}(?P<iface>[^,]+),(?:[^,]+),(?P<action>block|pass|reject),(?P<dir>in|out),(?P<ipver>4|6)(?:(?:,[^,]*){7},(?P<proto>[^,]+))?'
  - labels:
      action:
      dir:
      iface:
      proto:
You get action, dir, iface, and proto as proper Loki labels. Lines that are not filterlog (system events, DHCP, config changes) just pass through as-is.
Why not pull out source and destination IPs too? Every unique IP creates its own Loki stream. Your firewall sees thousands of unique IPs. Label them and your query performance tanks. Leave IPs in the raw log line and pull them out with LogQL when you actually need them.
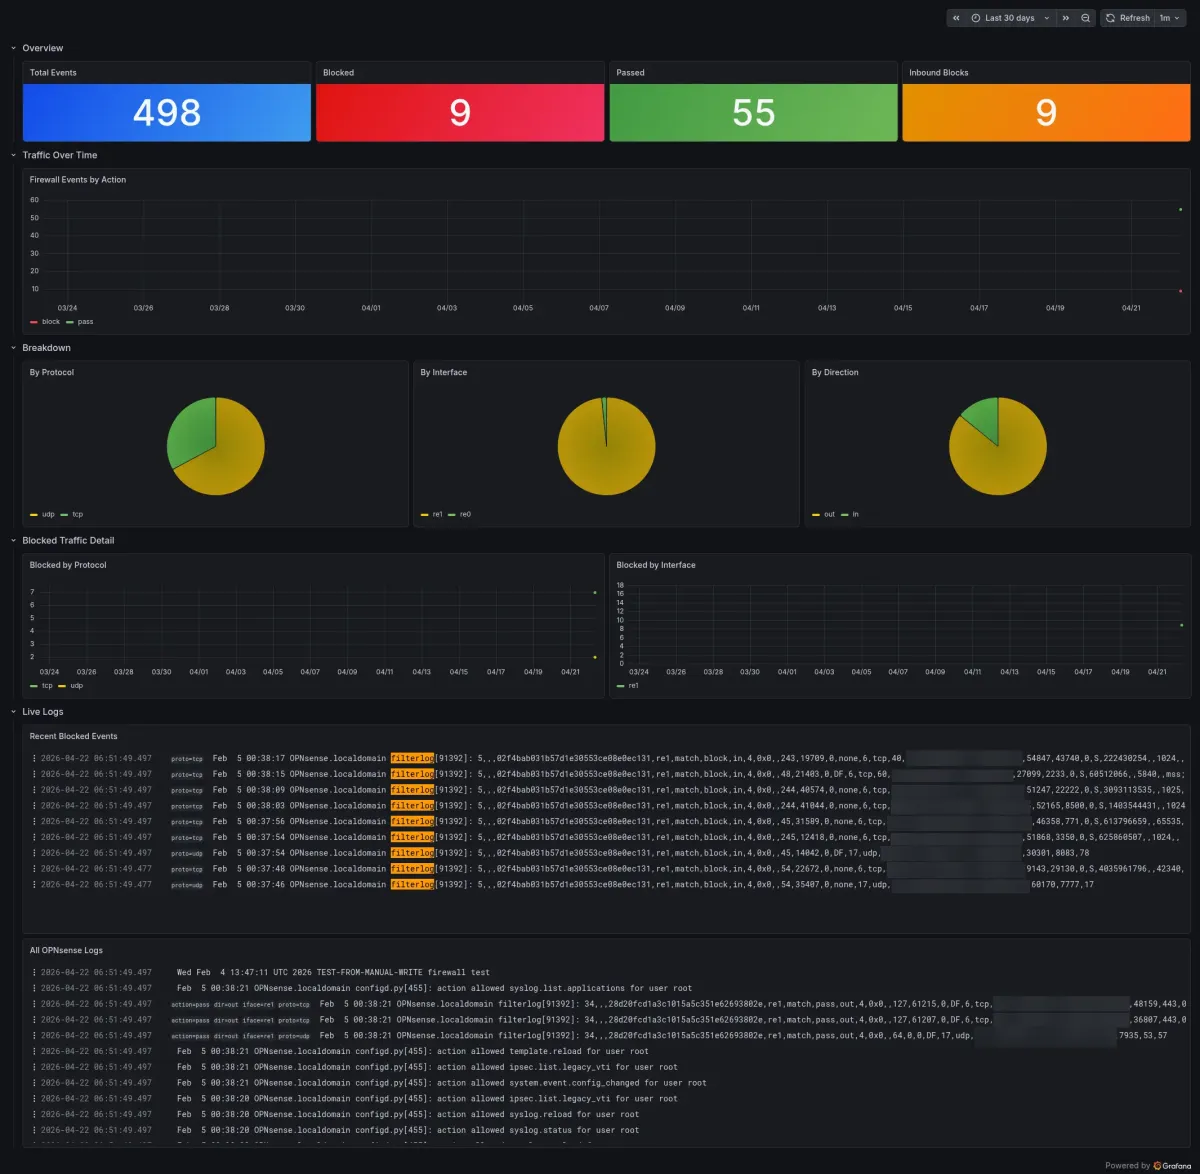
Building the Dashboard
Once you have real labels, Grafana queries are straightforward.
Blocked vs passed over time: sum by (action) (count_over_time({job="opnsense"}[$__interval])). Protocol split: sum by (proto) (count_over_time({job="opnsense"}[$__range])). Same pattern with iface if you want to see which VLAN or interface the traffic is coming through.
For a live feed of blocked connections only: {job="opnsense", action="block"} |= "filterlog".
Chuck the dashboard in a ConfigMap and it loads automatically every time Grafana starts. Lives in git with the rest of your infrastructure. No importing JSON through the UI every time you redeploy.
The Short Version
ClusterIPis not reachable from outside Kubernetes. OPNsense is on your LAN. syslog-ng needsLoadBalancer.- Promtail tails files. It does not receive syslog over UDP. Do not forward syslog to it from syslog-ng.
- OPNsense filterlog is CSV. Without a Promtail pipeline stage, everything in Loki is unreadable text you cannot filter.
- Label action, direction, interface, protocol. Keep source and destination IPs out of labels or query performance suffers.